
Configuring Envoy Logs, Taps and Traces
Learn how to configure Envoy's access logs, taps for capturing full requests & responses and traces

Photo by Kazuky Akayashi on Unsplash
Getting Started with Envoy & Open Policy Agent — 08 —
Learn how to configure Envoy’s access logs, taps for capturing full requests & responses and traces for capturing end to end flow
This is the 8th Envoy & Open Policy Agent Getting Started Guide. Each guide is intended to explore a single feature and walk through a simple implementation. Each guide builds on the concepts explored in the previous guide with the end goal of building a very powerful authorization service by the end of the series.
The source code for this getting started example is located on Github. ——> Envoy & OPA GS # 8
Here is a list of the Getting Started Guides that are currently available.
Getting Started Guides
- Using Envoy as a Front Proxy
- Adding Observability Tools
- Plugging Open Policy Agent into Envoy
- Using the Open Policy Agent CLI
- JWS Token Validation with OPA
- JWS Token Validation with Envoy
- Putting It All Together with Composite Authorization
- Configuring Envoy Logs Taps and Traces
- Sign / Verify HTTP Requests
Introduction
In this example we are going to use both a Front Proxy deployment and a service mesh deployment to centralize log configuration, capture full requests and responses with taps and to inject trace information. Logs and taps can be done transparently without the knowledge nor cooperation from our applications. However, for traces there cooperation from our app is required to forward the trace headers to the next link in the chain.
The diagram below shows what we will be building.

The Envoy instances throughout our network will be streaming logs, taps and traces on behalf of the applications involved in the request flow.
Let’s Start with Configuring Our Logs
Envoy gives you the ability configure what it logs as a request goes though the proxy. Envoy’s web site has documentation for access log configuration. There are a few things to be aware of:
- Each request / response header must be individually configured to make it to the logs. I haven’t found a log-all-headers capability. This is can be a good thing because sensitive information doesn’t get logged without a conscious decision to log it. On the other side of the coin, if you are using multiple trace providers, then you will miss trace headers from these other solutions until:
- You are even aware that they are in use
- You update the configuration for every node
- There is no ability to run analytics from the time they started being used. You will only be able to go back to the time you became aware of these new headers and updated your configurations.
- The property name
match_configthat we use in this article is entering deprecation when Envoy 1.16 comes out. I’ll will update this post to the new property name once 1.16 is released. - We will be using Elastic Common Schema in this example to the extent that we can with Envoy 1.15’s configuration limitations.
- Also coming with Envoy 1.16 will be nested JSON support. Once released I’ll update the example to switch from the dot notation used here to nested JSON.
Read through this snippet of envoy configuration. The full configuration files for our 3 envoy instances are located here:
Elastic common schema was introduced to make it easier to analyze logs across applications. This article on the elastic.co web site is a good read and explains it in more detail. The reference for elastic common schema provides names for many typical deployment environments, and cloud environments etc.
Below is the abbreviation envoy.yaml configuration that shows how to specify our logging configuration. The explanation of the configuration follows.
 1static_resources:
 2  listeners:
 3  ...
 4  - address:
 5    filter_chains:
 6    - filters:
 7      - name: envoy.filters.network.http_connection_manager
 8        typed_config:
 9          "@type": type.googleapis.com/envoy.extensions.filters.network.http_connection_manager.v3.HttpConnectionManager
10          generate_request_id: true
11          ...
12          route_config:
13          http_filters:
14          ...
15>          access_log:
16          - name: envoy.access_loggers.file
17            typed_config:
18>              "@type": type.googleapis.com/envoy.extensions.access_loggers.file.v3.FileAccessLog
19>              path: "/dev/stdout"
20>              typed_json_format:
21                "@timestamp": "%START_TIME%"
22>                client.address: "%DOWNSTREAM_REMOTE_ADDRESS%"
23                client.local.address: "%DOWNSTREAM_LOCAL_ADDRESS%"
24>                envoy.route.name: "%ROUTE_NAME%"
25                envoy.upstream.cluster: "%UPSTREAM_CLUSTER%"
26                host.hostname: "%HOSTNAME%"
27                http.request.body.bytes: "%BYTES_RECEIVED%"
28                http.request.duration: "%DURATION%"
29                http.request.headers.accept: "%REQ(ACCEPT)%"
30                http.request.headers.authority: "%REQ(:AUTHORITY)%"
31>                http.request.headers.id: "%REQ(X-REQUEST-ID)%"
32                http.request.headers.x_forwarded_for: "%REQ(X-FORWARDED-FOR)%"
33                http.request.headers.x_forwarded_proto: "%REQ(X-FORWARDED-PROTO)%"
34                http.request.headers.x_b3_traceid: "%REQ(X-B3-TRACEID)%"
35                http.request.headers.x_b3_parentspanid: "%REQ(X-B3-PARENTSPANID)%"
36                http.request.headers.x_b3_spanid: "%REQ(X-B3-SPANID)%"
37                http.request.headers.x_b3_sampled: "%REQ(X-B3-SAMPLED)%"
38                http.request.method: "%REQ(:METHOD)%"
39                http.response.body.bytes: "%BYTES_SENT%"
40>                service.name: "envoy"
41                service.version: "1.16"
42                ...
43  clusters:
44admin:
The access_log configuration section is part of the HTTP Connection Manager Configuration and at the same nesting level as the route_config and http_filters sections.
- We use a typed config
type.googleapis.com/envoy.extensions.access_loggers.file.v3.FileAccessLogin version 3 of the configuration API - The file path is set to standard out to so that log aggregation can be managed by docker.
- The
typed_json_formatproperty is what allows us to create logs in JSON Lines format - Envoy gives us template strings to insert into the configuration that it will replace with the request specific values at run time.
client.address: "%DOWNSTREAM_REMOTE_ADDRESS%". In these examples, we have pretty much used every available template string. The client section of elastic common schema holds everything that we know about the client application that is originating the request. We use dot notation here since nested JSON support is not available in Envoy 1.15 - Elastic Common Schema does not have standard names for everything. So we created a section for unique Envoy properties
envoy.route.name: "%ROUTE_NAME%" - The configuration language has macros that enable us to do lookups. In this example we lookup the X-Request-Id header and put it in the http.request.headers.id field
http.request.headers.id: "%REQ(X-REQUEST-ID)%" - We can insert static values into the logs for hardcoding labels such as which service the log entry is for etc.
service.name: "envoy"
Now Let’s Tackle Taps
Taps let us capture full requests and responses. More details are for how the tap feature works is located in the Envoy Documentation. There are 2 ways that we can capture taps:
- Statically configured with a local filesystem directory as the target for output. Envoy will store the request and response for each request in a separate file. The output directory must be specified with a trailing slash. Otherwise the files will not be written. The good news here is that you don’t need log rotate. You can have a separate process scoop up each file, send the data to a log aggregator and then delete the file.
- The second method for getting taps is by sending a configuration update to the admin port with a selection criteria and then holding the connection open while waiting for taps to stream in over the network. This would obviously be the preferred approach for a production environment.
Below is abbreviated structure of our Envoy.yaml config file. The highlighted section is the tap configuration. Taps are simply another available HTTP filter.
- We have match configuration that allows us to selectively target what we tap and what we don’t.
- The output configuration section is where we specify where the taps should be sent. For the
file_per_tapsink, remember to add the trailing slash to the path otherwise no files will be written. Additionally, the file path can’t be set to standard out due to the expectation that new files will be opened under the subdirectory that is specified.
 1static_resources:
 2  listeners:
 3  ...
 4  - address:
 5    filter_chains:
 6    - filters:
 7      - name: envoy.filters.network.http_connection_manager
 8        typed_config:
 9          "@type": type.googleapis.com/envoy.extensions.filters.network.http_connection_manager.v3.HttpConnectionManager
10          route_config:
11          http_filters:
12          - name: envoy.filters.http.tap
13            typed_config:
14              "@type": type.googleapis.com/envoy.extensions.filters.http.tap.v3.Tap
15              common_config:
16                static_config:
17                  match_config:
18                    any_match: true
19                  output_config:
20                    sinks:
21                      - file_per_tap:
22                          path_prefix: /tmp/any/
23          - name: envoy.filters.http.router
24            typed_config: {}
25          access_log:
26          ...
27  clusters:
28  ...
29admin:
30...
NOTE: The tap filter is experimental and is currently under active development. There is currently a very limited set of match conditions, output configuration, output sinks, etc. Capabilities will be expanded over time and the configuration structures are likely to change.
Enabling Traces
The overview documentation for Envoy’s Tracing features succinctly describes Envoy’s tracing capabilities very well. So, I have included a snippet here as a lead in to our configuration.
Distributed tracing allows developers to obtain visualizations of call flows in large service oriented architectures. It can be invaluable in understanding serialization, parallelism, and sources of latency. Envoy supports three features related to system wide tracing:
- Request ID generation: Envoy will generate UUIDs when needed and populate the x-request-id HTTP header. Applications can forward the x-request-id header for unified logging as well as tracing. The behavior can be configured on per HTTP connection manager basis using an extension.
- Client trace ID joining: The x-client-trace-id header can be used to join untrusted request IDs to the trusted internal x-request-id.
- External trace service integration: Envoy supports pluggable external trace visualization providers, that are divided into two subgroups:
- External tracers which are part of the Envoy code base, like LightStep, Zipkin or any Zipkin compatible backends (e.g. Jaeger), and Datadog.
- External tracers which come as a third party plugin, like Instana.
Tracing options are exploding and as such expect a lot of new capabilities to be added to Envoy. There are a great deal of configuration options already. We are demonstrating the simplest possible tracing solution. Therefore, configuration below leverages the built in support for Zipkin compatible backends (jaegar).
In lines 11 -19 below, the tracing configuration is standard part of the version 3 connection manager. The tracing property contains a provider.
- We have set up zipkin as the output format with jaegar as the configured destination. HTTP and gRPC are both supported. The example uses HTTP protocol for transmitting the traces.
- Our trace configuration refers to a cluster that we have named jaeger. So, we need to add a cluster configuration for it in the clusters section of the configuration file. Lines 28 through 40 points Envoy to our all-in-one jaeger container and port 9411 on that container.
 1static_resources:
 2  listeners:
 3  - address:
 4    ...
 5    filter_chains:
 6    - filters:
 7      - name: envoy.filters.network.http_connection_manager
 8        typed_config:
 9          "@type": type.googleapis.com/envoy.extensions.filters.network.http_connection_manager.v3.HttpConnectionManager
10          generate_request_id: true
11>          tracing:
12            provider:
13              name: envoy.tracers.zipkin
14              typed_config:
15                "@type": type.googleapis.com/envoy.config.trace.v2.ZipkinConfig
16                collector_cluster: jaeger
17                collector_endpoint: "/api/v2/spans"
18                shared_span_context: false
19                collector_endpoint_version: HTTP_JSON
20          codec_type: auto
21          route_config:
22            ...
23          http_filters:
24            ...
25  clusters:
26  - name: service1
27    ...
28>  - name: jaeger
29    connect_timeout: 1s
30    type: strict_dns
31    lb_policy: round_robin
32    load_assignment:
33      cluster_name: jaeger
34      endpoints:
35      - lb_endpoints:
36        - endpoint:
37            address:
38              socket_address:
39                address: jaeger
40                port_value: 9411
41admin:
42  ...
Running the Solution
There is a bash script in the 08_log_taps_traces directory that demonstrates the completed example. Just run ./demonstrate_log_tap_and_trace.sh The script does the following:
- It cleans up any left over files from a previous run.
- Creates temporary directories to hold the taps and log files that we will capture.
- Starts up 3 envoy instances, 2 services, and jaeger as drawn in our diagram at the top of this article.
- Shows the containers running for validation that there were no failures.
- Sends a request through the Envoy front proxy and onwards through the service mesh.
- Displays the custom access logs captured by each of the 3 Envoy proxies.
- These logs are captured in JSON Lines format.
- They are run through a tool called jq (running in a docker container).
- JQ pretty prints each log line and sorts the keys to make it easier to see the data groupings.
- Service 1 has 2 log lines since it captures the request as it goes into service 1 and it in turn calls service 2.
- Shows the taps captured in all 3 envoy instances. These taps show the full request and response details.
- The request and response bodies are base64 encoded in the taps in case they are binary. So, the script decodes each body that is available and shows it to the user.
- It uses the open command to open Jaeger in a web browser. If it doesn’t work on your operating system simply navigate to
http://localhost:16686/on your own. - Finally it shuts down the environment. It leaves all of the logs and taps in the
tmpdirectory for further inspection.
Let’s take a look at our traces
Jaeger Landing Page
The Jaeger landing page displays a summary of recent traces. It also enables filtering and selection of traces.

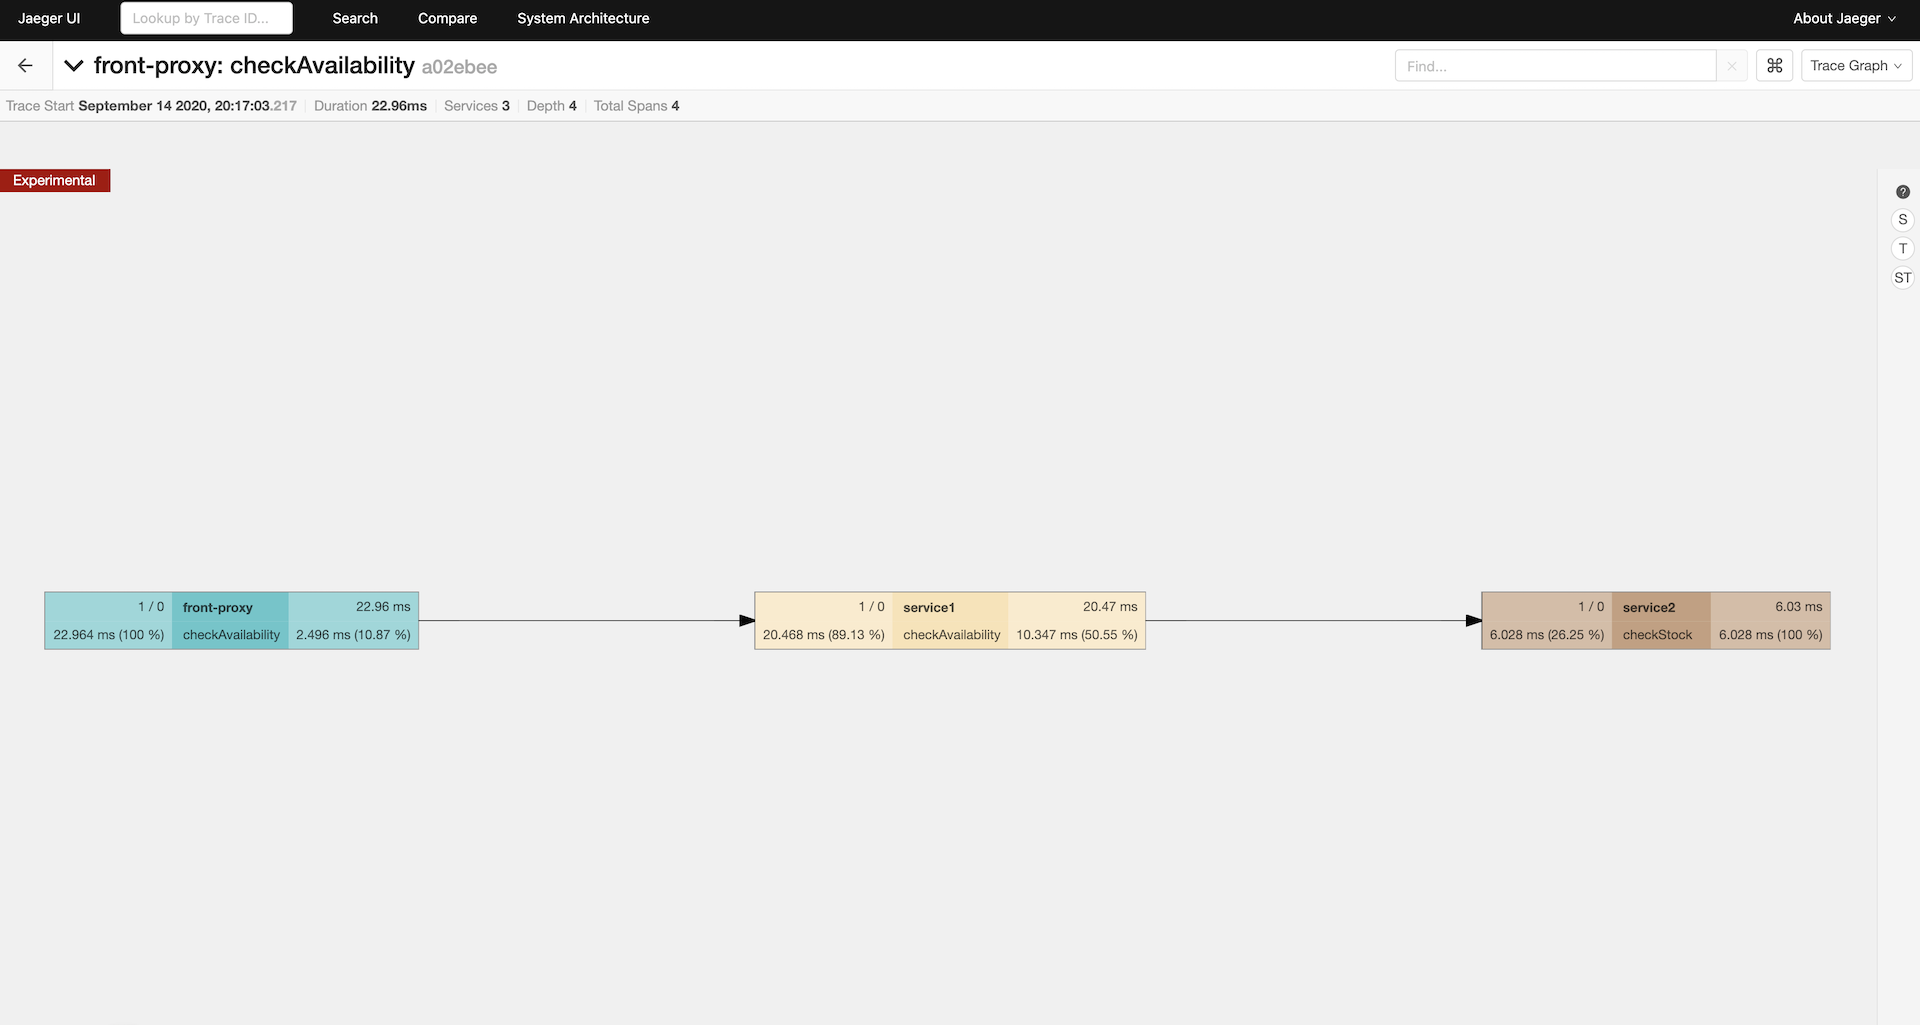
Call Graph
The Jaeger call graph page shows the entire call tree. Ours is pretty simple. It also shows response time details and where this trace fits withing the norms.
Trace Details
The Jaeger trace details page shows all of the tags that were captured at each leg of the request’s journey.

Congratulations
We have completed a tour of another Envoy feature. These observability features will come in handy as our system becomes more complex. Additionally, Envoy is a very powerful tool for intercepting our traffic in a legacy environment. This can give all of our legacy applications consistently formatted data across our entire environment. This super-power can be incredibly critical in an environment with a lot of older applications that don’t have active development, limited engineering knowledge and obsolete technology stacks.