
Adding Observability Tools
Learn how to add ElasticSearch and Kibana to your Envoy front proxy environment

Photo by Alex Eckermann on Unsplash
Getting Started with Envoy & Open Policy Agent — 02 —
Adding Log Aggregation to our Envoy Example
This is the 2nd Envoy & Open Policy Agent (OPA) Getting Started Guide. Each guide is intended to explore a single Envoy or OPA feature and walk through a simple implementation. Each guide builds on the concepts explored in the previous guide with the goal of creating a very powerful authorization service by the end of the series.
While our solution is still very simple, it is a great time to show how to make our solution observable with log aggregation. This makes it easier to think about how to scale and productionize our solution. As we start to develop and apply authorization rules at scale it will be handy to have all of the logs aggregated and displayed in one place for development and troubleshooting activies. In this article we will walk through how to setup the EFK stack to pull your logs together from all of the docker containers in your local development environment.
All of the source code for this getting started example is located on github. ——> Envoy & OPA GS # 2
Here is a list of the Getting Started Guides that are currently available.
Getting Started Guides
- Using Envoy as a Front Proxy
- Adding Observability Tools
- Plugging Open Policy Agent into Envoy
- Using the Open Policy Agent CLI
- JWS Token Validation with OPA
- JWS Token Validation with Envoy
- Putting It All Together with Composite Authorization
- Configuring Envoy Logs Taps and Traces
- Sign / Verify HTTP Requests
Solution Overview
The solution that we will build in this blog is shown below. We will send docker logs into an EFK stack that is also running inside docker. Each of the containers in our solution simply send logs to Standard out and / or Standard Error. No agents nor other special software is requirements are imposed on the observered applications.

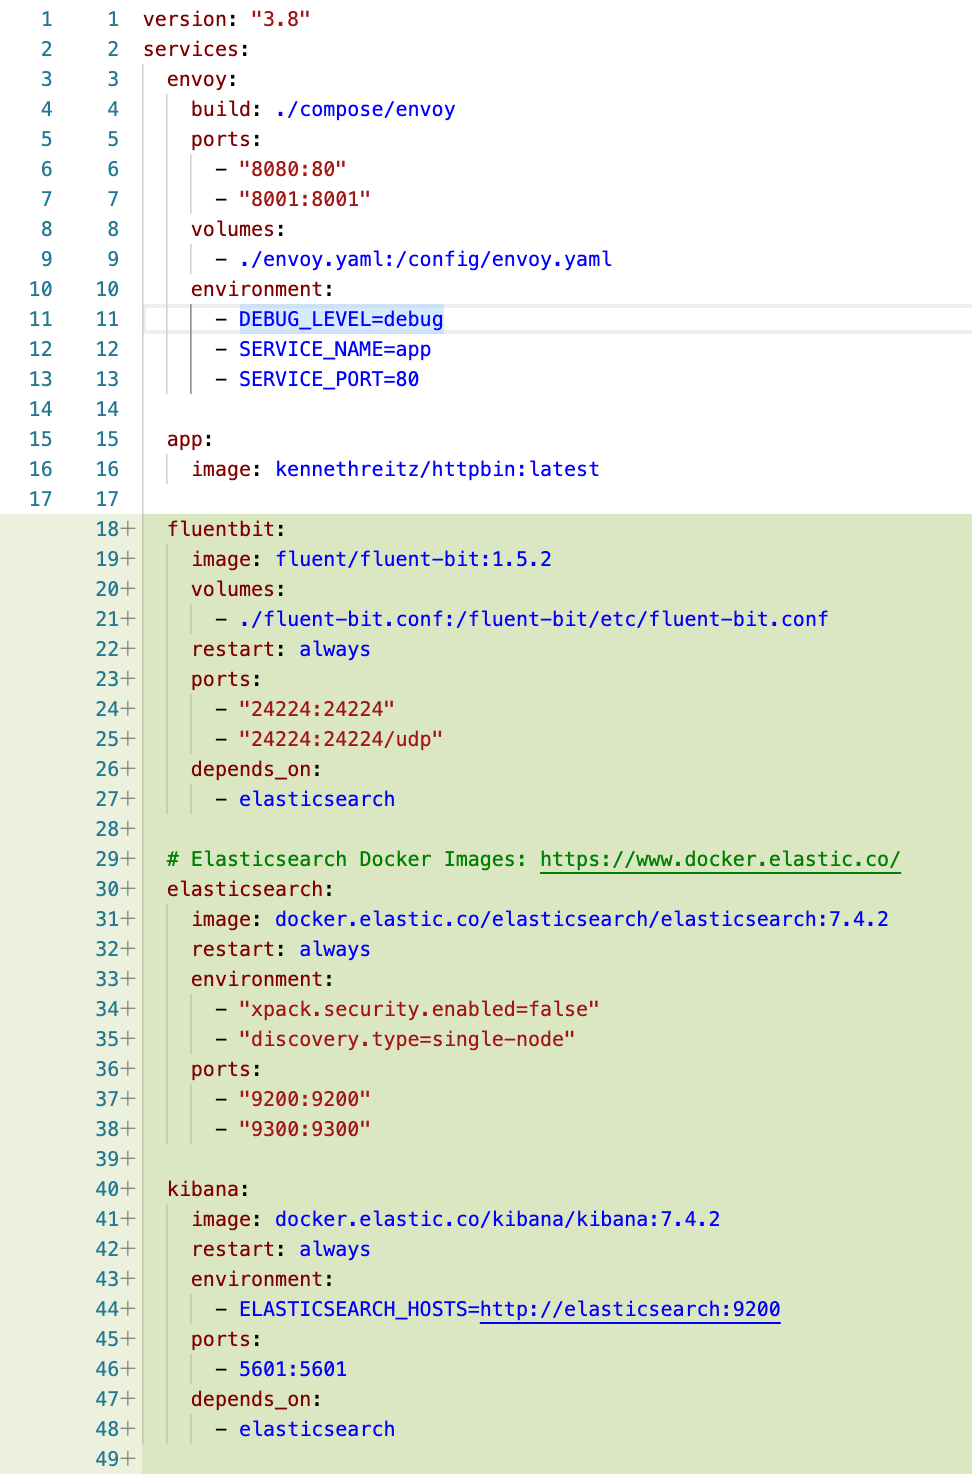
Adding EFK containers
We will be using Fluent Bit in this example because it is lite weight and simpler to deal with than Logstash or full fledged FluentD. Below is a very basic configuration with no special optimizations. Lines 18 - 49 add the EFK stack to our environment. Lines 16 and 47 use the depend_on property to cause docker to start elasticSearch first and then Kiban and Fluent Bit that depend on elasticSearch.
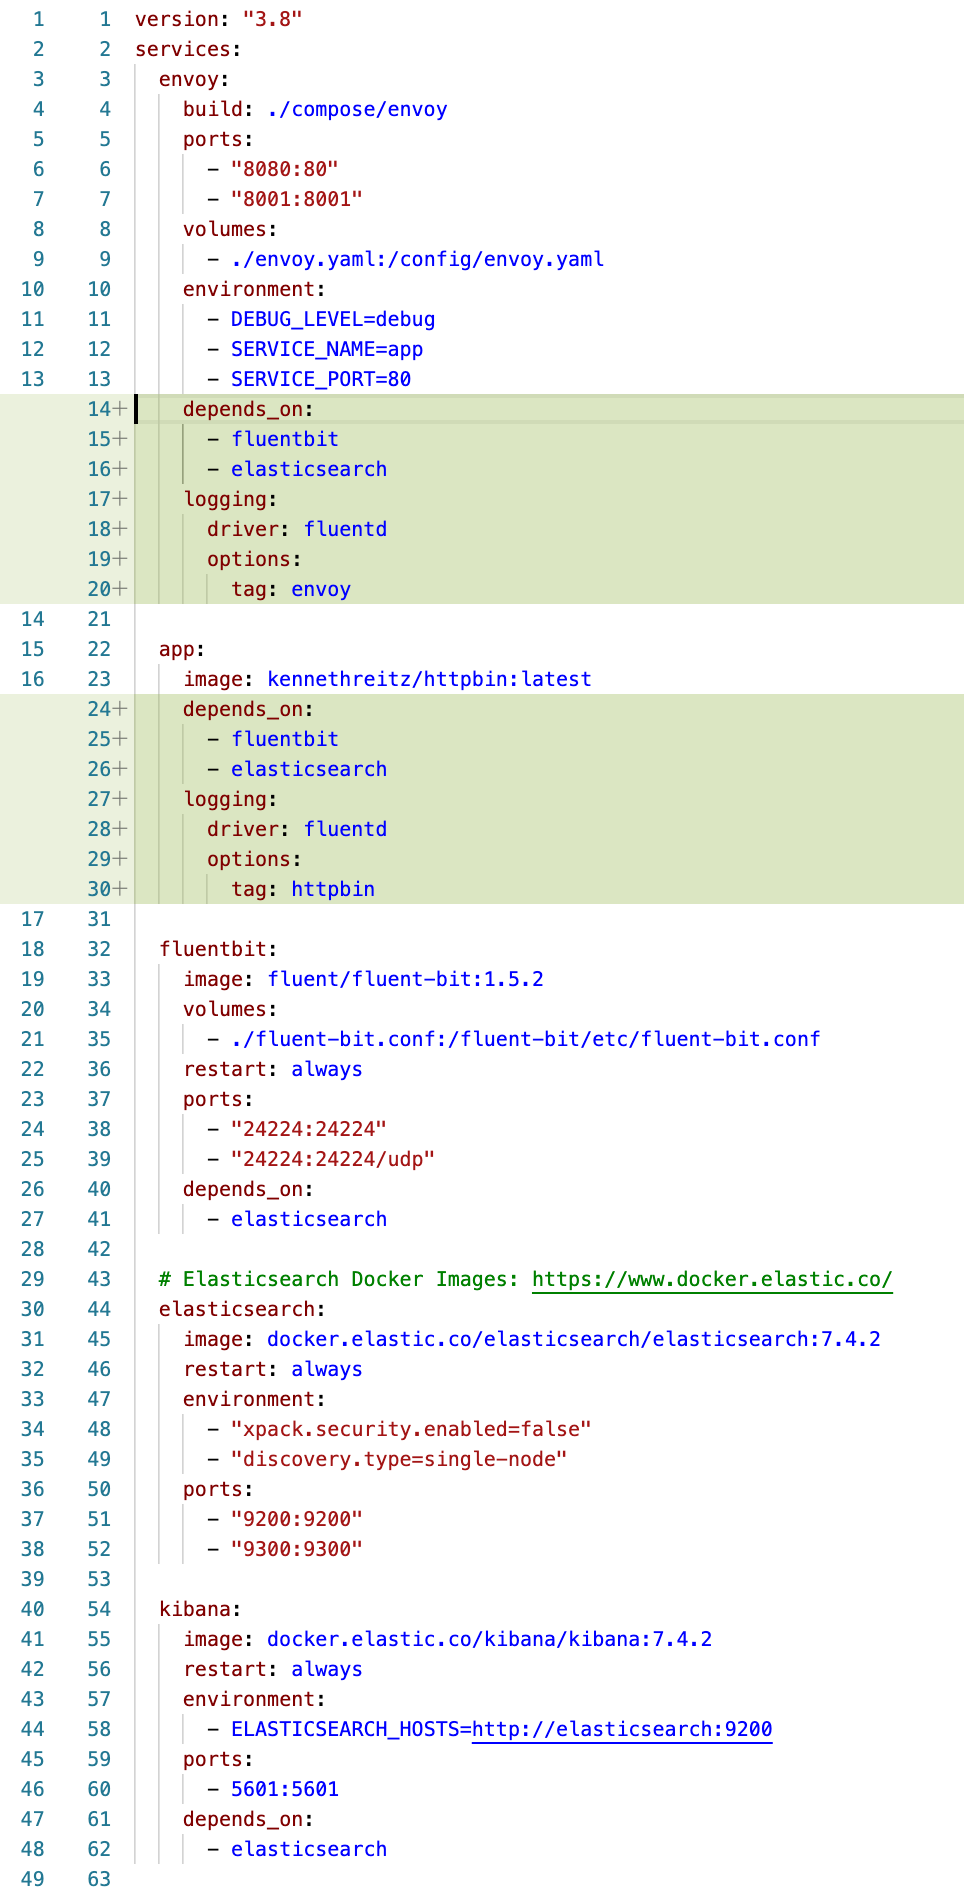
Wiring our containers into EFK
With the EFK log aggregation containers added to our docker-compose file, we now need to wire them into the other containers in our environment. The changes below show a couple of small changes that we needed to make to our compose file from where we left off in Getting Started Guide #1. We added the property at line 14 below which expresses our dependency on elasticSeach. Additionally, we need to wire standard out and standard error from our containers to Fluent Bit. This is done through the logging properties on lines 17 and 27. The driver line tells docker which log driver to use and the tag help make it more clear which container is the source of the logs.
Taking things for a spin
The demonstration script spins everything up for us. Just run ./demonstrate_front_proxy.sh to get things going:
- It downloads and spins up all of our containers.
- Then it waits 30 seconds to give elasticSearch some time to get ready and some time for Kibana to know that elasticSearch is ready.
- A curl command sends Envoy a request to make sure the end-to-end flow is working.
- If that worked, proceed forward. If not wait a bit longer to make sure elasticSearch and Kibana are both ready.
- If you are running on Mac OS X then the next step will open a browser and take you to the page to setup your Kibana index. If it doesn’t work, simply open your browser and go to
http://localhost:5601/app/kibana#/management/kibana/index_pattern?_g=()you should see something like this:
- I simply used
log*as my index and clicked next. Which should bring up a screen to select the timestamp field name.
Select@timestampand click create index. - You should see some field information about your newly created index.

- The script then uses the Open command to navigate to the log search interface. If it doesn’t work on your operating system then simply navigate to
http://localhost:5601/app/kibana#/discover. You should see something like this with some log results already coming in.
- If you have an interest, you may want to select the
container_nameandlogcolumns to make it easier to read through the debug logs and results of your testing efforts.
- The script sends another request through envoy and you should be able to see the logs coming into EFK.

- The script with then take down the environment.
In the next getting started guide, we will add in Open Policy Agent and begin experimenting with a simple authorization rule.